
If you're a B2B podcaster, you know that data is everything. It’s not just about celebrating another download spike; it’s about figuring out what makes your audience tick so you can drive real business results and prove your show’s ROI.
High-level download numbers are a decent vanity metric, but they barely scratch the surface. Real, strategic growth comes from digging into the specific actions your listeners are taking. This is where mastering Apple Podcasts Analytics becomes your secret weapon.
Your Guide to Navigating Apple Podcasts Analytics
Apple Podcasts Analytics is the free, built-in tool inside Apple Podcasts Connect that shows you exactly how listeners find and engage with your show. It gives you direct insight into plays, listener trends, and consumption habits on one of the biggest podcasting platforms in the world.
This guide will demystify the charts and metrics you see in your dashboard, turning what looks like a bunch of squiggly lines into actionable intelligence. We're going to move past simple definitions and get straight to how you can interpret this data to make smarter content decisions that actually move the needle.
What You Will Learn in This Guide
By the end of this guide, you'll be a more data-informed podcaster, ready to:
- Interpret Core Metrics: Finally, understand the crucial difference between Listeners, Plays, and Time Listened to get an accurate read on your audience size and how sticky your content really is.
- Analyze Engagement: Pinpoint the exact moments listeners drop off and identify the segments that keep them hooked, so you can double down on what works.
- Leverage Data for Growth: Turn your analytics insights into concrete actions that improve your show's ranking and visibility within the Apple ecosystem.
- Build a Complete Picture: Recognize the platform's limitations and learn how to pair its data with other sources for a full 360-degree view of your podcast's performance.
Here's a quick look at the dashboard you'll be working with. It gives you a snapshot of your show's key trends over time.
This overview is great for spotting high-level trends in listeners and plays. The first thing to get your head around is the difference between these two: one tells you your unique audience size, while the other tracks how many times your content was started. It's a fundamental distinction we’ll unpack soon.
For a deeper dive into how audience is measured across the industry, check out our guide on understanding podcast listener numbers.
Ultimately, our goal is to help you transform your podcast from just another piece of content into a powerful, measurable growth engine for your business. Let's get started.
Decoding the Core Metrics in Apple Podcasts
Opening your Apple Podcasts Analytics dashboard for the first time can feel like stepping into a cockpit, a blur of dials and numbers, each telling a small part of a much bigger story. To fly this thing, you need to know what each of those core metrics actually means. Getting this foundation right is your first step toward making smart, data-driven decisions for your B2B show.
These aren't just abstract numbers; they're direct signals from your audience. They tell you who's tuning in, how often they press play, and whether your content is good enough to make them stick around. Let's break down the three most fundamental data points you'll see.
Listeners: The Size of Your Unique Audience
Think of Listeners as the number of unique people walking into your store. This metric counts the individual devices that have played your show for at least one second within a specific time frame. It’s your best measure of audience reach, pretty much the same as "unique visitors" in the world of website analytics.
If one person listens to five different episodes on their iPhone, Apple counts them as just one listener. This is a crucial distinction. It gives you a clean, unduplicated picture of your audience size on the platform. Watching this number grow over time is a rock-solid indicator that your show is attracting new people.
Plays: The Initial Interest in Your Content
While Listeners count the people, Plays count the actions. A "Play" gets logged every time someone hits the play button on an episode for more than zero seconds. Back to our store analogy, this is like counting how many times people pick up a product to take a closer look. It measures initial interest.
A single listener can rack up multiple plays. For instance, if that one person listens to five episodes, your dashboard will show one listener and five plays. This helps you understand the total volume of activity and which specific episodes are sparking the most curiosity. You need to track both Listeners and Plays to get the full picture of reach versus activity. If you're looking for more ways to measure your show's impact, check out our guide on the top 10 B2B podcast metrics you need to track.
Time Listened: The True Test of Engagement
Time Listened is, without a doubt, the most important of the three core metrics. It measures content quality and how "sticky" your show is. This metric adds up the total time all listeners spent consuming your content. It finally answers the big question: "Are people actually listening, or are they just clicking and bouncing?"
A high number of Plays with a low Time Listened is a red flag. It often means there's a mismatch between your episode title or description and the actual content. You're getting the click, but you're not delivering on the promise, causing people to drop off fast.
This metric lets you move past vanity numbers and get to what really matters: genuine audience engagement. It’s a direct reflection of how valuable your audience finds your content. After all, holding someone's attention is the name of the game.
The podcasting world is crowded. Recently, there were over 4.52 million podcasts available worldwide, and Apple Podcasts hosts a massive 2.9 million of them (you can explore more stats on Podcast Index). With that much competition, every single minute a listener decides to spend with you is a win.
Analyzing Audience Engagement and Consumption Data
Core metrics like Listeners and Plays are a great starting point. They tell you about your audience size and whether your topics are grabbing initial interest. But they can't answer the most important question for any B2B podcaster: "Is my content actually resonating?"
To find that out, you need to dig deeper into the Apple Podcasts Analytics dashboard, focusing on engagement and consumption data. This is where you stop counting clicks and start understanding attention.
Downloads can be a vanity metric. True podcast success is about how long you hold your audience's attention, and this is where Apple gives you some of its most powerful insights. By dissecting episode performance, you can see exactly what parts of your show hook people and where they start to tune out.
This chart shows how those top-line metrics relate to each other.
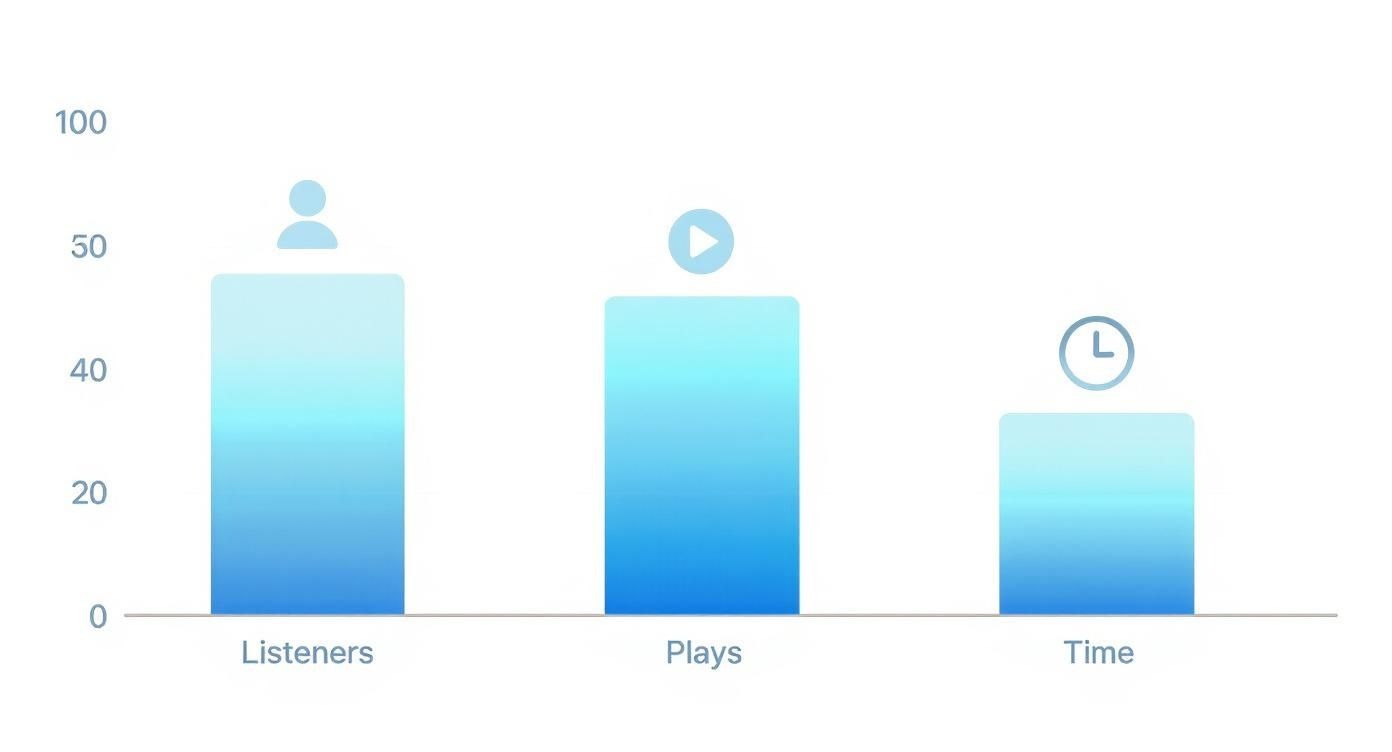
You'll often see listener and play counts looking pretty similar, but the time listened is almost always lower. That gap is the difference between someone starting your episode and actually finishing it.
The Power of the Episode Performance Graph
Inside Apple Podcasts Connect, the 'Episode Performance' graph is your command center for engagement. This visual timeline shows listener retention from the first second to the last, letting you see your content through your audience's ears.
Think of it like a heatmap for your audio. The peaks show where your content is most magnetic, while the valleys reveal the precise moments people hit the skip button or just drop off completely. For B2B podcasts, this data is pure gold.
Analyzing this graph isn't just a technical exercise; it's the closest you can get to sitting next to your ideal customer as they listen. It reveals their unfiltered reaction to your content, moment by moment.
Getting a feel for these patterns is fundamental. A nice, steady retention line means you’ve nailed it. But a sudden, sharp drop? That's an immediate signal that something in that segment needs fixing.
Decoding Average Consumption and Drop-Off Points
Within that performance graph, two data points demand your attention: Average Consumption and listener drop-off points.
Average Consumption is a simple percentage that shows how much of an episode the average listener actually hears. If you have a 40-minute episode with an average consumption of 75%, it means that, on average, listeners made it to the 30-minute mark. It's a fantastic high-level indicator of an episode's "stickiness."
But the really actionable intel comes from analyzing the drop-off points. These are the specific timestamps where you see a big chunk of your audience disappear.
Here’s how to look at them through a B2B lens:
- A big drop in the first 5 minutes: This almost always points to a weak intro. Maybe your hook wasn't strong enough, the intro music dragged on, or you took too long to get to the good stuff. Some studies show that podcasts can lose 20-35% of their audience right in those first five minutes.
- A dip during a guest interview: Could be a few things. Maybe the guest wasn't very engaging, their audio quality was poor, or the conversation went off on a tangent that wasn't relevant to your audience.
- A drop-off during a product mention: This is a classic B2B pitfall. If you see a consistent dip here, it’s a flashing red light that your pitch felt too salesy or wasn't woven into the conversation naturally.
On the flip side, seeing high retention during a customer case study or a tactical deep dive into an industry problem tells you you've struck gold. You've found a content format that your target audience genuinely values. For a broader look at what to track, you can find more on key podcast success metrics in our other guide.
A Framework for Reverse-Engineering Success
Don't just stare at the data, put it to work. Use this simple framework to turn your consumption analytics into a repeatable formula for creating killer content.
- Analyze Your Top 3 Episodes: Find your episodes with the highest Average Consumption. Listen back to them with the performance graph open on another screen. Pinpoint the segments with the highest retention. What do they have in common? Was it a specific guest, a particular format (like a tactical walkthrough), or a certain topic?
- Analyze Your Bottom 3 Episodes: Now, do the opposite. Pull up the episodes with the lowest Average Consumption. Find the exact moments where you saw major listener drop-offs. Was it a rambling intro, a clunky mid-episode ad read, or a segment that just lacked energy?
- Create a "Keep/Cut" List: Based on what you found, make a simple two-column list. Under "Keep," write down all the elements that consistently hold attention. Under "Cut," list everything that makes listeners tune out.
This process takes you from guessing what your audience wants to knowing what they want. It gives you the power to build a content strategy based on proven engagement, making every future episode that much more likely to hold your audience's attention from start to finish.
Understanding Your Listener Geography
Knowing what your audience listens to is one thing. Knowing where they are is a whole different ballgame.
Your Apple Podcasts Analytics dashboard breaks down your listener base by the top countries and cities where your show is catching on. This isn't just a vanity metric; it’s about turning anonymous downloads into tangible market opportunities.
Sure, Apple keeps the data aggregated to protect individual privacy, but the trends are pure gold for a B2B podcaster. You're not just looking at dots on a map; you're uncovering potential sales territories, spotting content localization needs, and finding emerging markets for your business before your competition does.

Leveraging Geographical Insights for B2B Strategy
Think of the "Top Countries" and "Top Cities" reports as your personal market intelligence feed. Stumble upon a surprisingly big listener base in a city you weren't even targeting? That's a massive signal to start digging. It could mean an untapped market is waiting for you, or that your industry has a quiet stronghold there.
This data helps you stop guessing and start acting.
- Inform Sales Outreach: See a spike in listeners from London? Your sales team can immediately prioritize outreach to prospects in the area, maybe even referencing local industry trends you just discussed on the show.
- Target Ad Campaigns: Noticing a growing audience in Toronto? Perfect. You can spin up geo-targeted LinkedIn ad campaigns promoting your podcast or a relevant lead magnet straight to that city.
- Guide Content Localization: If you see a significant audience in a non-English speaking country, it might be time to think about translated transcripts or even special episodes addressing their specific regional challenges.
Geographical data provides the context needed to turn your podcast from a broadcast medium into a precision marketing tool. It helps you focus your resources where they will have the most impact.
These insights get even juicier when you cross-reference them with data from Spotify or your podcast host. This helps you build a more complete picture of your global footprint and confirm if the trends you see on Apple are happening everywhere else.
Turning Global Data into Local Action
The fact that Apple Podcasts is a dominant player globally makes this data incredibly reliable. With over 500,000 active paid subscriptions, the platform has a massive and highly engaged user base. The United States alone accounts for 41% of its global traffic, with Canada and the UK right behind, making it a critical source of truth for North American and European markets.
This global reach can lead to some incredible wins. A specialized show, for example, can use these analytics to pinpoint niche audiences across different countries and tailor their content to rank in multiple international charts. It’s a powerful way to punch above your weight.
We've seen this work firsthand. To see how it plays out in the real world, check out our case study on how a radiology podcast is ranking across 9 countries by using this exact kind of data.
Ultimately, listener geography isn’t just about satisfying your curiosity. It’s about recognizing that every single listener represents a potential customer in a specific place, giving you the intel you need to guide your marketing, sales, and content strategy with deadly precision.
Actionable Strategies to Boost Your Podcast Rank
Alright, let's get down to business. Staring at your Apple Podcasts analytics dashboard is one thing; actually using that data to climb the charts is another game entirely. Data on its own is passive. Growth is active. This is where we connect the dots between the numbers you see and the impact you want to make.
The Apple algorithm can feel like a bit of a black box, but we know it rewards one thing above all else: engagement. Metrics like a steady stream of new followers, play velocity (how fast a new episode gets listened to), and especially a high average consumption rate are massive signals to the platform that your show is worth recommending.
Your job is to look at your analytics and figure out how to intentionally create more of those signals. It's a constant feedback loop: analyze listener behavior, refine your content, and promote it smarter.
This simple framework is your roadmap for turning analytics into a repeatable marketing process.
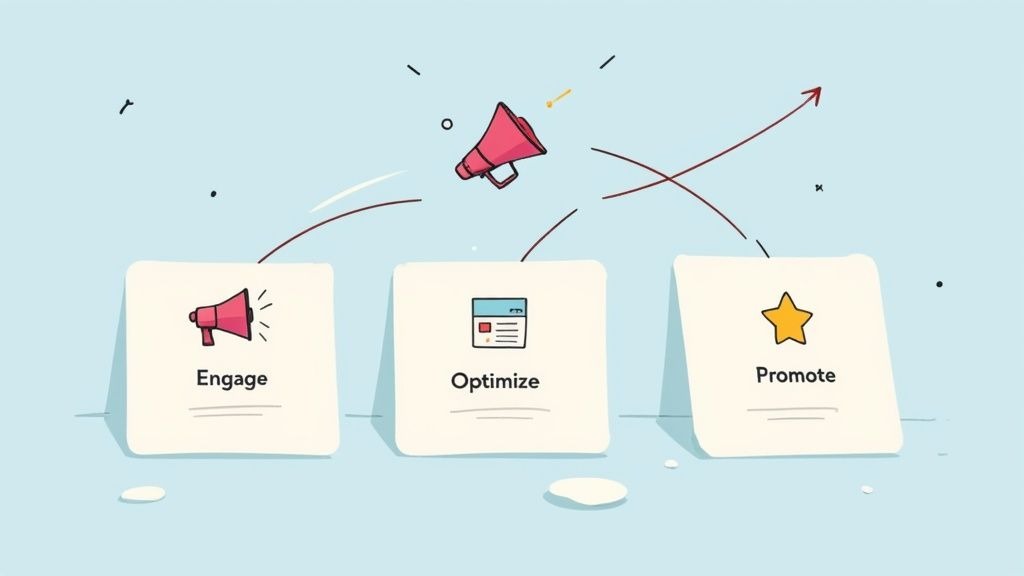
Engage your audience with content they can't turn off, optimize based on what the data tells you they love, and then promote your show to amplify what's already working.
Optimize Your Content Based on Consumption Data
Your episode consumption graphs are an absolute goldmine. They literally show you, second by second, where your audience leans in and where their attention drops off. This isn't about guesswork; it's about giving them more of what keeps them hooked.
Start by lining up your top-performing episodes, the ones with the highest average consumption. What's the common thread?
- Topic Clusters: Are your most binged episodes all about tactical marketing advice or deep dives into customer success stories? That's a clear sign to build a content pillar around that theme.
- Format Wins: Did a focused, solo deep-dive keep listeners glued to their headphones way longer than a rambling panel discussion? Your audience might be telling you they prefer a more direct, educational format.
- Guest Performance: Look at your guest episodes. A graph with high retention probably means you found a guest who really connected. A big drop-off could signal a mismatch in energy or expertise.
Use this data to build a "content playbook" for your show. This isn't about killing creativity; it's about creating a reliable formula for producing episodes that you know will resonate with your ideal B2B listener.
The table below breaks down how you can connect what you're seeing in your analytics to concrete actions.
Data-Driven Actions for Podcast Growth
Connect your Apple Podcasts Analytics data directly to strategic actions that can improve your show's ranking and engagement.
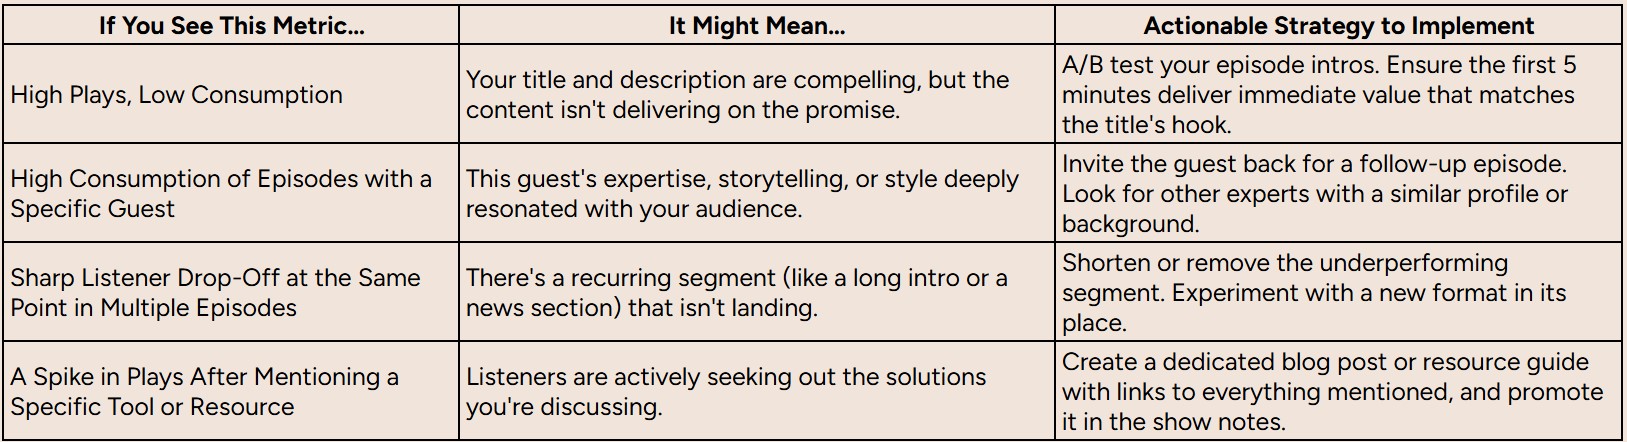
By paying close attention to these signals, you can move from just producing content to strategically engineering episodes that perform.
Craft Better Titles and Descriptions
Your episode title is your first impression, and it does double duty. It has to grab a human's attention and satisfy Apple's search algorithm. A great title promises value, while the description should be packed with relevant keywords that describe what a listener will actually learn.
Ever see an episode with a ton of plays but a shockingly low consumption rate? That's often a classic case of a clickbait-y title that didn't deliver. The listener felt misled and bounced. Use your data to make sure your titles are both compelling and honest.
Run Targeted Calls-to-Action (CTAs)
We all know that ratings and reviews are a ranking factor for Apple Podcasts. More positive ratings create social proof, which influences both the algorithm and potential listeners browsing the charts. But just asking for a review at the end of every episode is lazy and ineffective.
Instead, use your consumption data to find the perfect moment to make the ask.
- Find Your "High-Value" Moments: Scan your episode graphs for a point where engagement is still near its peak, usually right after you've dropped a major insight or a game-changing tip.
- Insert Your CTA: This is the ideal time to say, "If you found that tip valuable, the best way to thank us is by leaving a quick rating on Apple Podcasts." A listener who just had an "aha!" moment is far more likely to reciprocate.
This is a much smarter approach than a generic plea. For a deeper dive into growing your listener base, check out our guide on audience development strategies. When you start tying your analytics directly to your content and marketing, you build a repeatable system for growth.
Supplementing Your Data Beyond Apple Analytics
While Apple Podcasts analytics gives you some incredibly valuable engagement data, it doesn’t tell you the whole story.
Relying on it alone is like trying to understand your company's health by only looking at one department's performance report. To make genuinely smart decisions, you need the complete picture of your audience and the impact your show is having.
The platform’s biggest blind spot is its scope; it only tracks what’s happening inside the Apple ecosystem. On top of that, all the data is anonymized to protect listener privacy. This means you won’t see detailed demographics or how people found your show. You can see that people listened, but not who they are (beyond a city) or how they discovered you.
Creating a Holistic View of Your Audience
To get around these limitations, you have to bring in data from other sources. This is how you turn isolated data points into a cohesive story about your podcast's performance across the entire digital landscape.
Think of it as assembling a team of specialists. Each data source brings a unique skill set to the table, and together, they give you the full picture.
Here are four practical ways to build that team:
- Your Podcast Host's Analytics: Your hosting provider (like Libsyn, Buzzsprout, or Fame Host) is your source of truth for total downloads. It tracks downloads and streams across all platforms, not just Apple. This is where you go to understand your total audience reach and see what’s happening on other directories like Spotify or Google Podcasts.
- Listener Surveys: The best way to understand your audience? Just ask them. Use short, simple surveys, promoted on your show and in your newsletter, to gather the demographic and firmographic data you can't get anywhere else. Ask questions like, "What's your job title?" or "How did you first hear about our podcast?"
- Unique Vanity URLs and Coupon Codes: Want to measure direct response from a specific episode? Create a unique, easy-to-remember URL (like yourcompany.com/podcastoffer) for a call-to-action. Tracking traffic to that specific page gives you concrete data on exactly how many listeners took action. It's simple, but it works.
- Website Analytics: This is where you connect your podcast efforts back to your primary business asset, your website. Set up goals in Google Analytics to track how many visitors from your vanity URLs or show notes pages go on to sign up for a demo, download a whitepaper, or join your email list.
Beyond these podcast-specific tactics, it helps to understand the general principles of analytics in advertising. Even if you aren't running ads, the concepts of tracking, attribution, and user behavior can provide valuable context for your overall strategy.
By weaving these different data sources together, you break free from the walled garden of a single platform. You create a multi-dimensional view that connects your podcast's engagement directly to tangible business outcomes, giving you the clarity you need to prove ROI and scale your show effectively.
Frequently Asked Questions
Diving into podcast data always stirs up a few questions. Let's tackle some of the most common ones you'll run into with Apple Podcasts analytics.
What Is the Difference Between Apple and Hosting Provider Data?
Think of your podcast host (like Fame Host or Buzzsprout) as the bouncer at the front door of a massive club. They count every single download that goes out, no matter which app or platform it's headed to. This gives you the big-picture number, your total reach.
Apple Podcasts analytics, on the other hand, is like having a spy inside one specific, very important room in that club. It tells you what your Apple listeners are actually doing once they're inside. How long did they stay? Where did they get bored and leave?
So, your host data tells you "how many," while Apple's data tells you "how well" you're engaging a critical slice of your audience.
How Long Does Data Take to Appear in Apple Podcasts Connect?
You’ll need a little patience here. The numbers in your Apple Podcasts Connect dashboard aren't live. They typically lag by about 24 to 48 hours.
This is a big deal when you drop a new episode. Don’t panic if you don't see instant results. To get a true feel for how an episode is landing, it's best to wait at least a week. That gives the data time to settle and paint a much more accurate picture of listener behavior.
Can I See Who My Individual Listeners Are?
Nope, and for good reason. Apple is serious about user privacy, so all the data is aggregated and completely anonymized. You can see the total number of unique devices and get a general sense of where they are (like a city or country), but you'll never be able to pinpoint or track a person.
This is a critical point for B2B marketers. The privacy-first approach means you can't rely on Apple's data alone for lead gen. You have to get creative with other methods, think listener surveys, unique URLs mentioned in the episode, or dedicated landing pages, to gather the specific firmographic info you need for attribution.
Ready to turn your podcast into a measurable growth engine? Fame is a B2B podcast production agency that helps companies like yours build authority and drive a qualified pipeline. See how we do it at Fame.