
Apple Podcast Analytics is the free, in-house tool that gives you a direct look at how listeners are behaving within Apple's massive ecosystem. It's the only way to get a true read on audience retention and engagement from one of the world's biggest podcast platforms. Use it to stop guessing and start making data-driven decisions.
Why Apple Podcast Analytics Is Your B2B Compass
In the noisy world of B2B podcasting, just counting downloads is a fool's errand. Raw numbers tell you how many, but they don't tell you who is listening or why they stick around. To build a show that actually drives business results, you need a reliable compass.
For B2B marketers, Apple Podcast Analytics is that compass.

This platform gives you a direct line to a huge and valuable slice of your audience. Industry stats consistently show Apple Podcasts holding around 37% of the audio-only listening share in key markets like the U.S. That's a massive chunk of your potential customer base you simply can't ignore.
Use the insights you find here to turn abstract listening data into a concrete content strategy that moves the needle on your business goals.
Why Focus on Apple Podcast Analytics
Diving into Apple's data helps you connect your podcasting efforts directly to tangible marketing goals. Here’s a quick breakdown of the actions you can take based on this critical B2B data.
Key Area: Strategic Action for B2B PodcastersAudience Market Share. With over a third of the market, use Apple's data as a representative sample to validate your content strategy before scaling it. Content StrategyAction: Analyze retention graphs to identify which topics, guests, and formats resonate, then create more of that winning content.Lead NurturingAction: Find where listeners drop off to pinpoint weak CTAs. Rewrite your scripts to make those moments more compelling. B rand AuthorityAction: Track follower growth month-over-month. If it's stagnating, test new episode titles or promotional tactics to re-engage your audience.
Ultimately, this platform is less of a report card and more of a strategic guide. It points you toward what resonates, helping you build a show that not only attracts listeners bualso t contributes directly to your bottom line.
Moving Beyond Vanity Metrics
Way too many B2B podcasts get stuck tracking simple downloads. It’s a classic vanity metric that feels good but offers zero strategic value. Apple’s data lets you graduate from these surface-level numbers to focus on what actually drives growth.
Here’s how you can put it into practice:
- Gauge Content Resonance: Find out which topics and guests really grab your ideal customer's attention by seeing where they stay glued to their headphones. Action: Create a "Top 5" list of your episodes with the highest average consumption and look for common themes to replicate.
- Refine Your Messaging: Use audience retention graphs to pinpoint the exact moments listeners tune out. Action: If you see a drop during your intro, shorten it to get to the value faster in your next episode.
- Build Brand Authority: A steadily growing follower count on Apple Podcasts is a clear sign you're building a loyal community of professionals who see you as a trusted authority. Action: Set a quarterly follower growth target to stay focused on building loyalty.
- Inform Your Business Plan: The data you gather provides invaluable feedback for your entire content strategy. Action: Use your top-performing episode topics to inform your blog, webinar, and social media content for the next quarter. Feed this data into your business plan for a podcast.
Mastering Apple Podcast Analytics isn't just about checking stats; it's about listening to the story your audience is telling you through their actions. It allows you to make data-informed decisions that strengthen your brand and drive demand.
Getting Your Hands on the Data in Minutes
Getting to your data shouldn't feel like a chore. Think of your Apple Podcast Analytics dashboard as mission control for your show, once you know the layout, you can pull the insights you need in seconds.
This guide will show you exactly how to get in, navigate the interface, and find what you need quickly. The goal is to spend less time clicking and more time acting on what the numbers mean.
Before you start, make sure you have two things ready:
- Your podcast is already live and submitted to Apple Podcasts.
- You have the Apple ID you used to submit the show.
Ready? Let's log in and get to work.
Step-by-Step: How to Access Your Analytics
Finding your analytics is straightforward. Apple keeps it simple, so it only takes a couple of clicks to get from the login screen to your show's performance data.
- Log into Apple Podcasts Connect: Go to Apple Podcasts Connect and sign in with your designated Apple ID. This is your home base.
- Pick Your Show: If you run more than one podcast, you'll see a list. Click the cover art for the show you want to analyze.
- Click the 'Analytics' Tab: Once you select your show, a navigation bar appears at the top. Find the Analytics tab and click it. That’s it, you're in.
This quick process lands you right on the main overview screen, where your show's most important data is waiting.
Here's a look at the user interface you'll be working with.
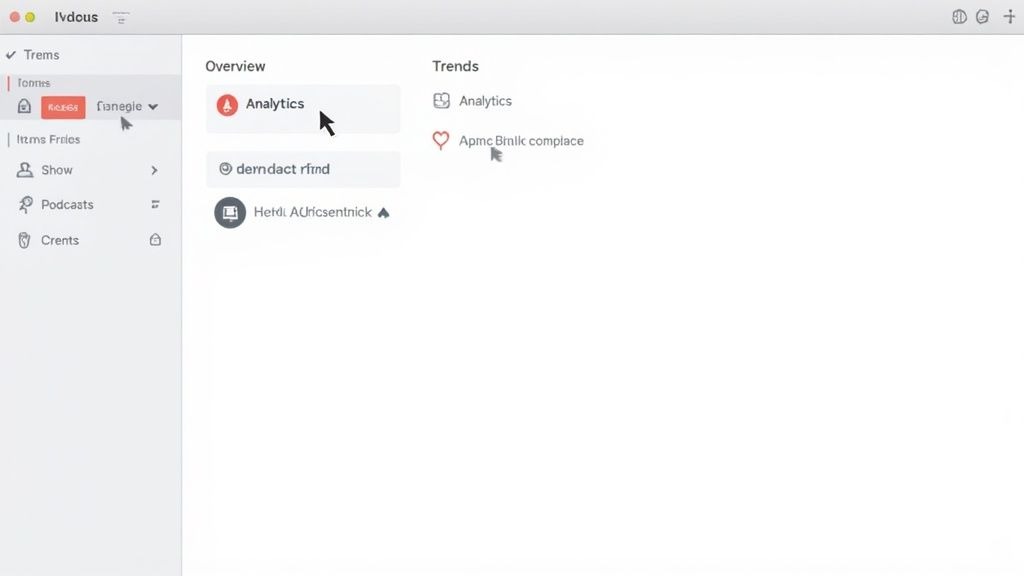
As you can see, the layout is clean and organized, giving you a snapshot of high-level trends and episode performance right away.
A Quick Tour of the Main Dashboard Tabs
The dashboard is split into three main tabs, each with a specific job. Knowing what's in each tab is key to finding the info you need without getting lost.
- Overview Tab: This is your 30,000-foot view. Action: Check this weekly to monitor the overall health of your show, total listeners, engaged listeners, and followers, over a selected time frame.
- Episodes Tab: This is where you get granular. Action: Use this tab monthly to sort episodes by plays and engagement. Identify your top-performing and underperforming content to see what's resonating.
- Trends Tab: This tab zooms out to show long-term movement. Action: Review this quarterly to track follower growth, average listening duration, and other data points to measure the real impact of your content strategy over time.
A simple way to think about it: the Overview tab is your daily briefing, the Episodes tab is a performance review for each project, and the Trends tab is your quarterly report on strategic growth.
Once you get the hang of this simple layout, you’ll be able to navigate your Apple Podcast Analytics with confidence. That means less fumbling around and more time turning numbers into real, actionable insights for your B2B podcast.
Translating Core Metrics Into B2B Strategy
Raw data is just noise until you give it a purpose. Inside your Apple Podcasts Connect dashboard, every number tells a story about your audience. To build a powerful marketing asset, you must translate that story into strategy.
Let's decode the core metrics, focusing on the actions they signal for your business goals. This is how you turn abstract figures into concrete intelligence that shapes your content, refines your messaging, and proves your show's value.
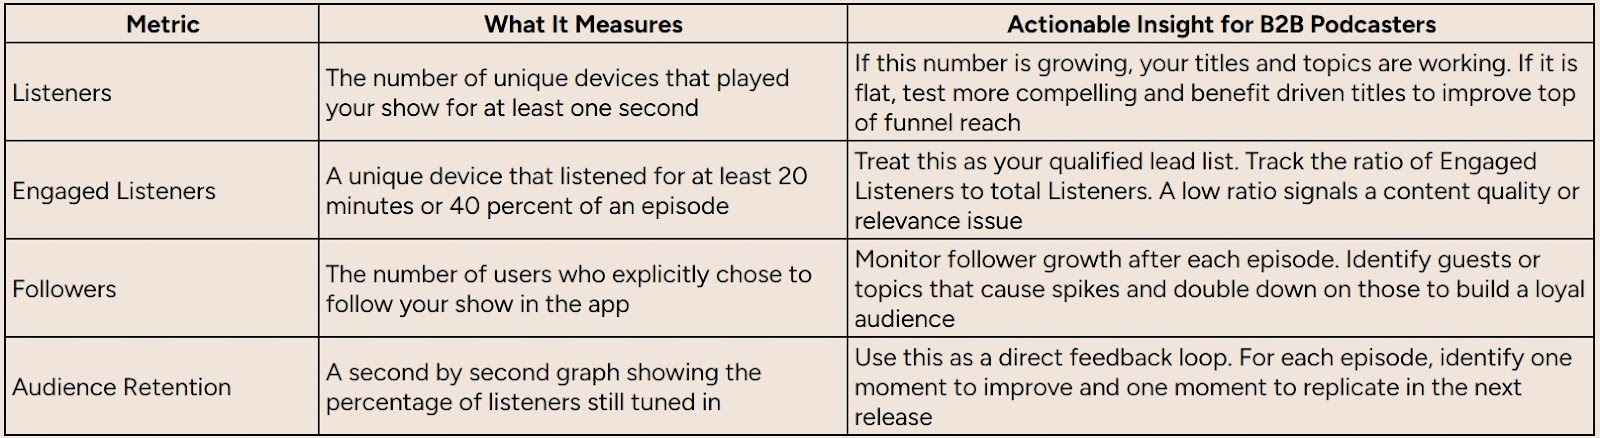
Here's a quick rundown of the most important metrics and the actions they should inspire.
Now that we have the lay of the land, let's dig into what these numbers look like in the real world and how to interpret them.
Listeners vs. Downloads: A Crucial Distinction
The first metric you'll see is Listeners, which counts unique devices that played your show for at least one second. This is far more insightful than a simple download count, which could just be an automatic download that never gets played.
Think of it this way: downloads are like sending out direct mail. You know it arrived, but you have no idea if anyone opened it. Listeners are the people who actually opened the envelope.
Action Plan: If your Listener count is stagnant, focus on improving your podcast's "curb appeal." Test new cover art, write more benefit-driven episode titles, and craft show notes that are optimized for search.
Engaged Listeners: Your Most Valuable Audience
Next is a far more powerful metric: Engaged Listeners. This is a unique device that has listened for at least 20 minutes or 40% of an episode, whichever is shorter. These are not casual browsers; they are your core audience.
An Engaged Listener is your ideal customer profile in action. They are actively consuming a significant portion of your expert content, which is a strong indicator of high purchase intent and brand affinity.
Action Plan: Your primary goal should be to convert Listeners into Engaged Listeners. Calculate your engagement rate (Engaged Listeners / Listeners). If this rate is below 50-60%, it’s a red flag. It means your content isn't delivering on the promise of your title, and you need to adjust your episode format or substance.
Followers: The Loyalty Metric
Followers are users who have explicitly decided to follow your show. This is a direct measure of brand loyalty. A follow is a vote of confidence; it's a user saying, "I trust you enough to want your content delivered to me automatically."
In B2B, a follower is like a lead opting into your email list. They have given you permission to enter their space regularly.
Action Plan: End every episode with a clear, direct call-to-action: "If you found this valuable, hit the follow button in Apple Podcasts so you never miss an episode." Tracking follower growth over time is one of the best ways to measure the long-term health and authority of your podcast.
Putting It All Together: A B2B Scenario
Imagine your B2B podcast releases an episode titled "Mastering SaaS Sales Cycles with AI." Your Apple Podcast Analytics show the following:
- Listeners: 5,000 (Strong reach! Your topic is attracting attention.)
- Engaged Listeners: 3,500 (Excellent! 70% of listeners found the content valuable enough to stick around.)
- Followers: +150 (A solid number of new listeners were impressed enough to subscribe.)
This data provides a clear insight you can act on immediately. Your audience of B2B professionals is hungry for deep-dive content on AI in sales. Your next move: Plan a follow-up episode or a mini-series on this theme to further nurture this high-intent audience segment. You can explore more ways to interpret data by learning about the 10 B2B podcast metrics you need to track in our detailed guide.
Dissecting the Audience Retention Chart
The Audience Retention chart is the most powerful tool in your analytics suite. It shows you, second by second, what percentage of your audience is still listening. This graph is your direct feedback loop.
When analyzing this chart, look for three key moments and take specific actions:
- The Initial Drop-Off: See a steep drop in the first minute? Your intro is too long, or your hook is weak. Action: For your next episode, script a powerful, one-sentence hook and deliver it within the first 30 seconds.
- Engagement Peaks: Did retention stabilize or even tick upward? That's your content gold. Action: Go to that timestamp in your recording. Identify what was happening: a guest interview, a case study, a practical tip, and build a future episode around that single concept.
- Significant Dips: A sharp drop mid-episode signals a problem like a jarring ad break or a confusing tangent. Action: Note the timestamp and avoid that type of segment or transition in the future. Edit more ruthlessly.
By cross-referencing these moments with your episode transcript, you can pinpoint exactly what to replicate and what to avoid. This is how you constantly refine your content to maximize engagement. For a broader understanding of how different platforms measure success, it can be useful to look at concepts from other media, like AI Revenue Analytics for YouTube and TikTok Creators.
Using Audience Retention to Perfect Your Content
If the core metrics are your show's vitals, then the audience retention graph is its EKG. It's the most powerful diagnostic tool in your Apple Podcast Analytics dashboard, telling you the second-by-second story of how listeners experience your show.
Learning to read this graph lets you stop guessing what works and start using hard data to structure every episode for maximum impact.
Think of the retention graph as direct, unfiltered feedback. Every peak, plateau, and drop-off is a message telling you what's boring, what's exciting, and the exact moment they checked out. Your job is to listen and act.
Decoding the Story in Your Retention Graph
The graph itself is simple: it plots the percentage of your audience still listening at any given point. A high, flat line is the dream, but the real lessons are in the dips and spikes. This is where you move beyond simple downloads and start understanding true engagement.
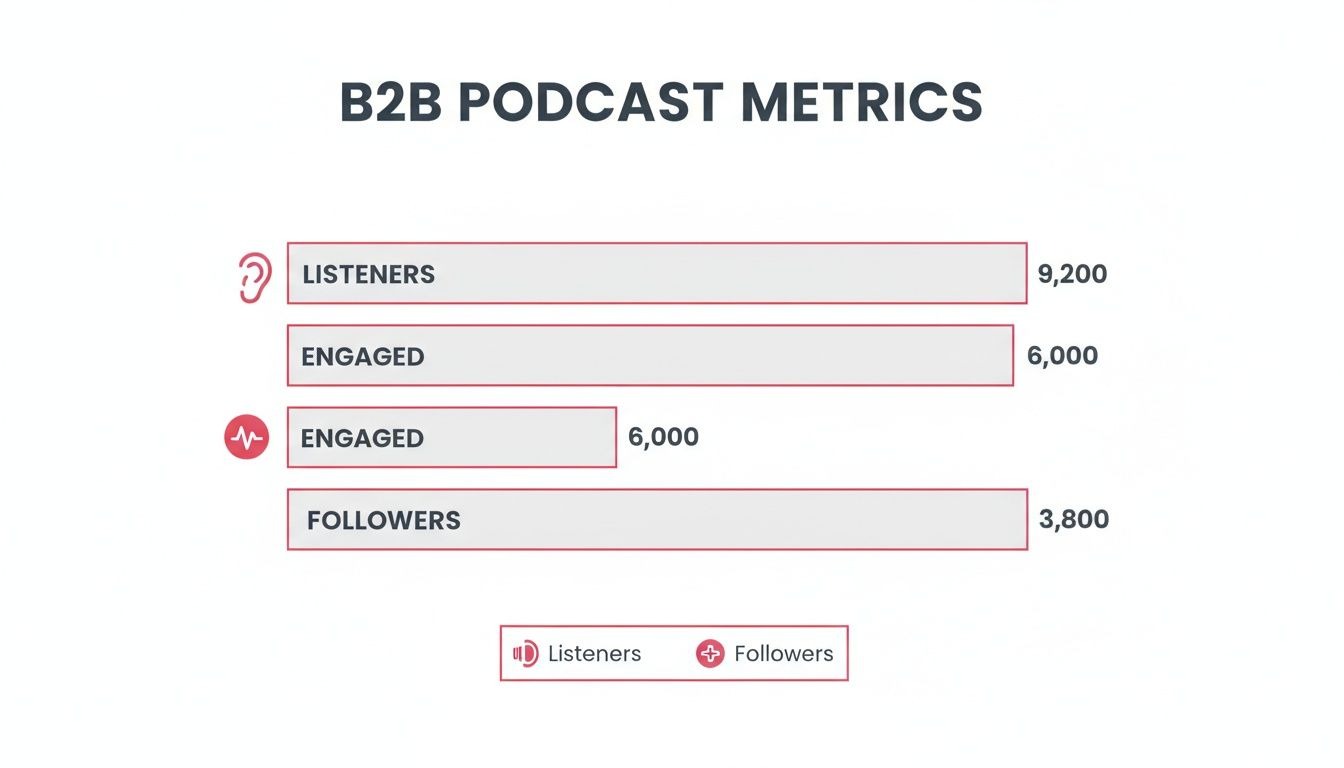
As the chart shows, attracting listeners is just step one. The real goal is to turn them into engaged listeners and, ultimately, loyal followers.
To take action on your retention graph, break your analysis into three critical parts.
- The First Five Minutes (The Hook): A steep drop-off here is a red flag that your intro isn't working. Your Action: Trim your intro music, skip the lengthy bio, and get to the core value within the first 60-90 seconds. State exactly what the listener will learn by the end of the episode.
- The Middle Ground (The Meat): Look for plateaus; these are your "content gold" moments. Your Action: Pinpoint these segments. Was it a practical how-to, a guest's personal story, or a data-backed insight? Identify the format and topic, and immediately add similar ideas to your content calendar.
- The Dips and Spikes (The Red Flags & Green Lights): A sudden, sharp dip usually points to a specific problem, like a jarring ad read or a tangent that went nowhere. A spike, where people rewind, signals a high-value point. Your Action: Note the timestamps for both. Eliminate the dip-causing elements and turn the spike-causing insights into standalone social media clips or blog post snippets.
For a B2B podcast, the retention graph is your ultimate content focus group. It tells you if your product mentions are compelling or off-putting, if your customer stories are relatable, and if your expert advice is actually hitting the mark.
Actionable B2B Scenarios from Retention Data
Let's translate this into the real world. By looking at your Apple Podcast Analytics with a strategic eye, you can pull out insights that directly shape your content strategy.
- Scenario 1: The Product Pitch Drop-Off
- The Data: You notice a consistent 15% drop in listenership every time you mention your company's latest feature release.
- The Insight: Your audience is here to learn, not to be sold to. The direct pitch is turning them off.
- The Action: Stop the direct pitch. Instead, weave your product's value into a customer success story. Frame the feature as the solution to a problem your guest is discussing. Make it contextual and valuable, not promotional.
Scenario 2: The Case Study Plateau
- The Data: During a 10-minute segment where you walk through a real customer's journey, your retention line stays almost perfectly flat at 85%.
- The Insight: Your audience is hungry for tangible, real-world examples.
- The Action: Double down on this format. Make case studies a regular feature. Your next step: Reach out to three successful customers and invite them onto the show for a dedicated case study episode.
Perfecting your content is a constant process of listening and adapting. The data in your retention graph gives you the roadmap. Review it after every episode to refine your structure, sharpen your messaging, and build a show that keeps listeners hooked.
For more tips on growing your listener base, explore these proven audience development strategies.
Seeing the Whole Picture Beyond Apple's Data
While Apple Podcast Analytics offers a sharp, detailed snapshot of a huge chunk of your audience, it's just one piece of a much bigger puzzle. Relying only on Apple's data is like trying to map a city by only looking at one neighborhood; you get a fantastic view of that area, but you miss the bigger picture.
Your listeners are also on Spotify, YouTube, and other platforms. To make truly strategic decisions, you need to zoom out and build a complete view of your entire audience.
The Inherent Limitations of Apple's Data
Apple’s analytics platform operates within a walled garden, showing you only what's happening inside the Apple ecosystem. This creates two massive blind spots: data from other apps and listener demographics.
You're missing data from every other listening app. The episode crushing it on Apple might be a flop on Spotify, and you'd have no idea. More importantly for B2B, Apple gives you zero demographic information like listener age, location, or job title.
Think of Apple Podcast Analytics as a high-resolution camera focused on your most important market. It gives you incredible detail, but to see the whole landscape, you need to add other data sources.
Actionable Steps to Fill the Gaps
Building a comprehensive measurement strategy is about layering different data sources to create a complete dashboard for your show. Here are three practical steps you can take today.
1. Integrate Your Podcast Host Analytics
Your podcast host, like Transistor or Libsyn, is your source of truth for universal download stats. Unlike Apple, your host tracks downloads across every platform.
- What to Track: Monitor total downloads per episode, geographic listener data, and which apps people are using to listen.
- Actionable Insight: If you see a surge of listeners in a specific country, you can start tailoring content or ads to that region. If you notice 30% of your audience is on Spotify, you know it's time to pay serious attention to Spotify's features and analytics.
2. Use Trackable URLs for CTAs
How do you know if your podcast is driving website traffic or demo requests? Use trackable URLs. Instead of just saying "visit our website," create unique links for your show.
Your Action Plan: Use a free service like Bitly to create a unique link for the CTA in your next episode (e.g., bitly.com/YourPodcastOffer). Mention this simple link on the show and put it in your show notes. This gives you hard data on how many listeners are taking action, directly tying your podcast to business outcomes. For a complete overview, check out our guide on how to measure podcast performance.
3. Deploy Simple Audience Surveys
The best way to get demographic and qualitative data is to just ask for it. A short, simple survey unlocks rich insights that no analytics platform can provide.
- How to Do It: Use a free tool like Google Forms or SurveyMonkey. Create a quick survey (5-7 questions max) asking about job titles, industries, biggest challenges, and what content they want more of.
- Promotion: Announce the survey in your intro and outro, and drop the link at the top of your show notes. Pro-Tip: Offer a small incentive, like a gift card drawing or exclusive content, to dramatically increase response rates.
Apple Podcasts reportedly hosts around 2.91 million podcasts, making discovery a challenge. By piecing together a multi-source analytics strategy, you can stand out by truly understanding and serving your entire audience. To get a better handle on your content's overall impact, you can explore broader guides on how to analyze content performance.
Building Your B2B Podcast Measurement Routine
Data is useless unless you act on it. Now that you understand Apple Podcast Analytics, the final step is building a simple, repeatable process that turns numbers into action.
This isn’t about getting lost in spreadsheets. It’s about creating a quick, effective monthly habit that improves your content and proves your podcast’s value.
Think of it as your monthly "podcast health check." This simple routine transforms data review from a chore into a core part of your growth strategy.
Your Monthly Four-Step Framework
Block off 30 minutes each month for this process. That's all it takes to get a clear picture of what's working, what's not, and what to do next.
- Check High-Level Trends (5 mins)
Start with the big picture. In the Overview tab, look at your overall Listeners and Followers for the last 30 days. Are the lines moving up and to the right? This is your gut check. If not, it's a signal to revisit your promotion strategy. - Identify Your Top & Bottom Performers (10 mins)
Go to the "Episodes" tab and sort by listeners. Identify your most popular and least popular episodes of the month. The real winners have both high listener counts and high average consumption. Action: Write down the topics, guests, and formats for both. - Analyze Retention Extremes (10 mins)
This is where the gold is. Pull up the retention graphs for your best and worst episodes side-by-side. What did you do in the hit episode that kept people hooked? What happened in the weaker one? Action: Identify one key difference (e.g., intro length, segment type) and create an action item for your next recording session: "Do more of X, do less of Y." - Connect Insights to Business Goals (5 mins)
Tie it all back to your objectives. Did the episode promoting a new whitepaper see a retention spike during the CTA? Did that interview with an industry leader cause a jump in followers? Action: Report these findings to your team. This is how you prove ROI and make data-driven decisions that support your marketing efforts.
By consistently analyzing your data, you move from creating content in a vacuum to strategically building an asset that resonates with your ideal customer. It’s the key to turning listeners into leads.
This simple routine ensures you’re always learning. For a deeper dive on what to track, check out our guide on essential podcast success metrics. Making this a regular practice is the most effective way to use Apple Podcast Analytics to build a show that drives real business results.
Burning Questions
Even after you get the hang of your data, a few common questions always seem to pop up when you're digging into Apple Podcast Analytics. Here's a quick rundown of the most frequent ones.
Use this as your go-to reference to clear up any confusion so you can get back to what matters: growing your show.
Can I See Who My Listeners Are?
The short answer? No. Apple is famously protective of user privacy, so you won’t find any demographic data like age, gender, location, or the holy grail for B2B, job titles. You can see what your audience does on the platform, but not who they are.
To get that kind of intel, you have to take action:
- Just Ask Them: Put a link to a simple audience survey in your show notes. Ask for the specific information you need to build your listener persona.
- Check Your Host: Your podcast host (like Transistor or Libsyn) can at least give you geographic data, showing which countries or cities your downloads are coming from.
How Often Does Apple Podcast Analytics Update?
Apple crunches the numbers and updates its analytics about once every 24 to 48 hours. This isn't real-time data, so you won’t see a spike the second a new episode goes live.
Actionable Tip: Don't check your stats obsessively on launch day. Wait at least two full days after publishing a new episode before you analyze its performance. This gives Apple enough time to process the data and give you a reliable first look.
Why Do My Host's Numbers Differ From Apple's?
This is the most common point of confusion. The numbers are different because your podcast host and Apple are measuring two completely different things.
- Your Host counts downloads. This is a server request for the audio file, recorded across every platform (Spotify, Overcast, etc.). It doesn't mean anyone listened.
- Apple counts listeners and plays. This data is only from their ecosystem (Apple Podcasts) and only registers when someone actually hits the play button.
Because of this, your host's download count will always be higher than your listener count in Apple Podcast Analytics. Your Action: Use your host's numbers for total reach and Apple's data for deep engagement analysis. Both are valuable for telling different parts of your podcast's story.
Ready to turn your B2B podcast into an authority-building, lead-generating machine? Fame is the agency built for B2B companies that want a show that drives real business results. We take care of everything, strategy, production, promotion, so you can focus on being the expert. Start building your authority with Fame today.